What Does "Normal" Mean, Anyway?
Setting a basis of comparison for weather
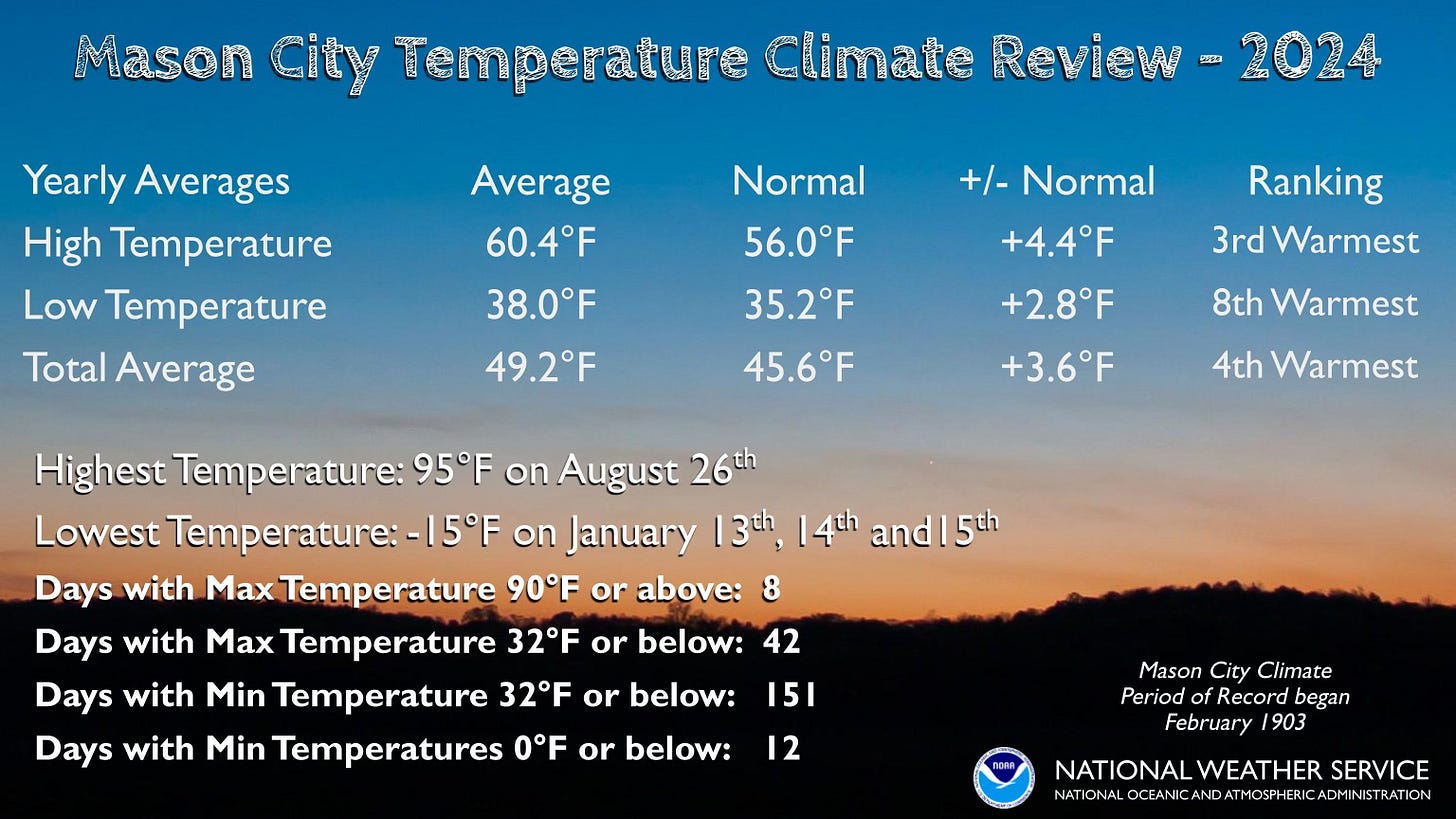
As 2025 begins, meteorologists across the weather enterprise (that is, the meteorologists you see on TV, in the National Weather Service, in state and regional climate offices, at universities, and more) will be posting their year-in-review summary of 2024. Those summaries look at the superlatives of the year - warmest, coldest, wettest, driest, and snowiest, at least. They also put the year into context - was it the warmest? wettest? 3rd warmest? coldest since 1990? To do so, they will look at the average temperatures and total precipitation through the whole year (and sometimes season by season or month by month), comparing them to something they will label “normal” as well as to the rankings for all years in the records.
“Normal” is one of those words that means something very different to meteorologists (or other scientists) than it does in everyday conversation. (Words like “positive reinforcement” and “theory” fall into this category, too, but we’ll get to those another time.)
What Does Normal Mean?
Mama Gump might have used the phrase in a very different context from weather, but she goes right to the core of our question. We all have a different sense of what “normal” means to us. When weather and climate people talk about “normal” weather, or temperatures being “above normal,” what do they mean?
Normal, Defined
In the weather and climate world, “normal” has a strict definition. A climate “normal” is an average, calculated by NOAA’s National Centers for Environmental Information (NCEI), for a 30-year reference period, for the weather variable at hand. (You could also call it a comparison period.) The calculations are not a pure average of observed temperatures - those values are corrected for quality-control errors, station moves, and instrument changes. They’re close to a straight-up average of the observations through those thirty years, but they are not exactly the same.
Right now, the 30-year reference period, as accepted and defined by the World Meteorological Organization, is 1991-2020. It shifts every ten years, so the next shift will occur in 2031 when we move to a 2001-2030 normals period.
So, an above-normal temperature means that compared to temperatures in 1991-2020, the temperature is above the average. The same is true of precipitation: below-normal precipitation means that compared to precipitation in 1991-2020, the precipitation is below the average.
Normals are set for daily, monthly, and annual temperatures, precipitation, snowfall, and snow depth at all first-order stations and most COOP and AWOS stations across the United States - about 15,000 sites in the 1991-2010 normals. Stations must have mostly complete records for those thirty reference years in order to be included, so brand-new stations have to wait a while until they can have normals calculated. COOP stations that close down will lose their normals in the next update.
Normal Is Not Average
One thing to make clear is that the “average” temperature (or rainfall or snow or any other weather variable) is not synonymous with “normal.” An average could be calculated for any period of time, not just the specific reference period. (Often, scientists will calculate an average for the whole length of the record at a site, or for a 100-year period, or some other duration of interest.) It is important for scientists to be clear about which one they are using or referencing. Normals and averages can suit different needs and situations, and sometimes it makes more (or less) sense to use one over the other.

Normal is Not, Well, “Normal”
Normal is not a synonym for “expected.” (Here’s a little tidbit about Dr. Barb: I intensely dislike the adage “Climate is what you expect, and weather is what you get,” and the reason for my dislike is related to this discussion.)
The conditions on any given day will very rarely match the normals for the day. Weather is full of bumps in the road, nudging conditions above or below normal (for temperatures and precipitation) on any given day. The range of usual conditions, based on that 1991-2020 comparison period, could be really wide or somewhat narrow. A “near-normal” high temperature could fall within a range of 5 degrees or 15 degrees, depending on the location and time of year. It could be “normal” in some climates to not receive any precipitation at all for an entire month. Or, a “normal” daily rainfall might look like 0.15 inches on paper, but what it really looks like is about 5 days in a month with about 0.75 to 1.0 inches of rain and a lot of dry days in between.
The normals smooth out some of the bumps of daily weather, and sometimes a monthly normal is more meaningful than a daily normal. Sometimes the real story of the normals is buried deeper in the statistics over longer periods of time.
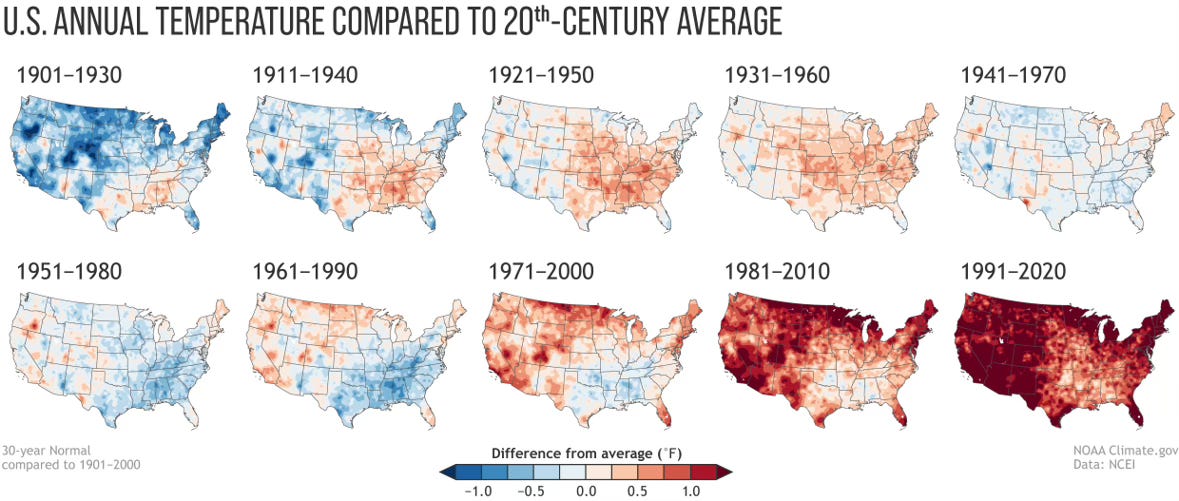
To put it a different way, the normals don’t tell the full story. The range of those past conditions adds meaning to the normals, rounding out more of the story. Even those are not complete, though, without understanding how normals may be shifting. Source: NCEI and a supporting article from NOAA.
A New Normal
The phrase “new normal” comes up quite a bit in climate change discussions. The origin of the phrase is simple arithmetic - the average temperature and precipitation has changed at most sites with the latest release of normals compared to the one before it. Not every station across the United States is warming evenly, but most sites are warming measurably, especially in certain seasons and often more in the minimum temperatures than the maximum temperatures. (I’ll reflect on that another time.)
Precipitation is trickier. Some places are getting wetter, some drier. Some are seeing about the same amount totaled through the year, but they’re getting that amount in bigger downpours with longer dry spells between. Sometimes the amount is the same, but it’s increasing in one season and decreasing in another. Studies like the National Climate Assessment, and summaries like this helpful one from NOAA, help us understand how those changes look across the United States.
Often, the “new normal” phrase reflects on an increase in the number of weather-related disasters, like wildfires or floods. NCEI does not calculate official normals for such events, so in this use, the phrase is more colloquial rather than being a product of precise arithmetic. It does not make the concept any less valid - indeed, many types of weather disasters are increasing in frequency in measurable ways. If I was being super nit-picky, I might have suggested that people find a different phrase, just to avoid confusion. Maybe the “climate change disaster shift” or the “bear market on catastrophes” would better communicate the increase in these events without implying there is a calculated “normal” for them.

Our next set of new normals will come after 2030. Given the heat already in the 2020s, I expect (oops, I don’t like the word “expect”) foresee a high likelihood that we will see noticeable shifts toward warmer temperatures in many locations.
What shifts have you noticed where you live?
For more information: NCEI: U.S. Climate Normals
This Month in Wilder Weather History
January 3-4, 1881: According to Cindy Wilson, author of The Beautiful Snow, the last train to pass through De Smet before train service ceased for the rest of winter likely came through on January 3 or 4, 1881. Without train service, food and fuel supplies became scarce for the homesteaders and those living in newly established railroad towns like De Smet. While Laura Ingalls Wilder dubbed the winter of 1880-1881 “The Long Winter,” it was more common for others to refer to that winter as “The Hard Winter” or “The Starvation Winter,” and the lack of trains was an important cause of food shortages that winter.


I feel like "The Starvation Winter" would be a hard sell as a title for a children's novel...🤣
There is a great tool from the High Plains Regional Climate Center, to "roll-your-own" climate data periods. See https://hprcc.unl.edu/ncei-cct/